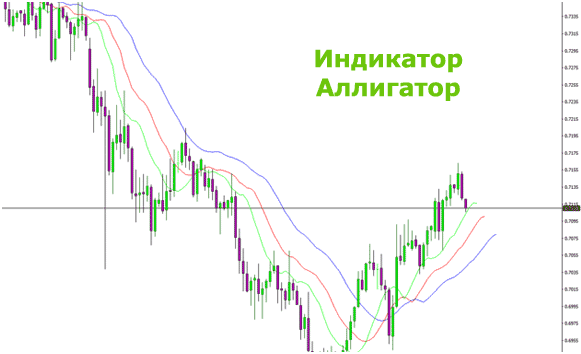
The trend indicator “Alligator” (Williams Alligator) was developed in 1995 by the American trader B. Williams, a specialist in the field of market psychology. His idea was based on the assumption that assets are in a state of growth or decline on average from 15% to 30% of the time of the trading session. It is during these periods that investors receive the main profit. “Alligator” is able to show the beginning and end of such intervals.
- What the Alligator indicator consists of and how it looks on the chart
- Setting up the Alligator indicator in the terminal
- Setting up the indicator in the Quik terminal
- Setting up the indicator in the MetaTrader terminal
- Alligator indicator with alert
- Trading Strategies with Alligator
- Trades in a sideways range
- Pullback trading
- Moving Average Crossover Analysis
- Combination of indicators “Alligator” and “Fractals”
- Errors in interpretation
What the Alligator indicator consists of and how it looks on the chart
“Alligator” includes 3
moving averages that have periods of 5, 8, 13 and are shifted 8, 5, 3 bars into the future, respectively. Each of them has its own name and unique characteristics:
- “Alligator’s jaw”, or SMMA (median price, 13, 8), colored blue.
- Alligator teeth, or SMMA (median price, 8, 5), colored red.
- “Alligator Lips”, or SMMA (median price, 8, 5), colored green.
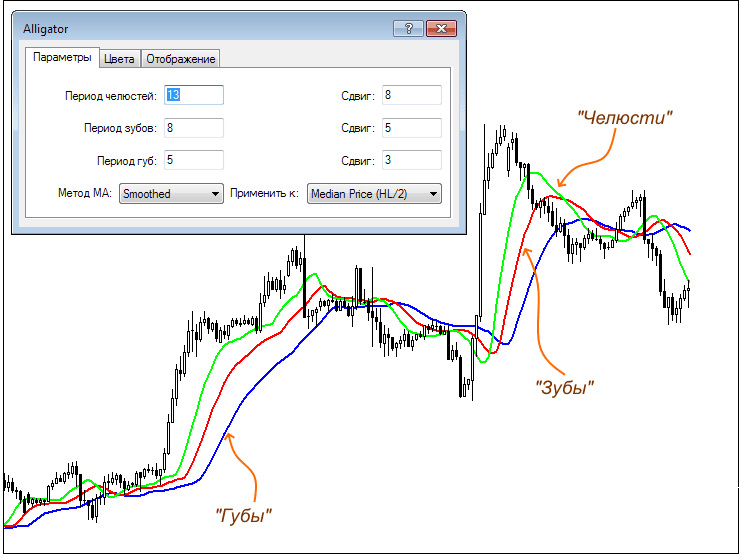
When the Alligator Lips cross other moving averages from top to bottom, this indicates the possibility of selling the asset, from the bottom to the top – about the possibility of buying.
The indicator can be used as the only technical trading tool. But to improve forecasts, it is recommended to take into account other data: price behavior, volumes, etc.
Setting up the Alligator indicator in the terminal
“Alligator” is included in the standard set of
trading terminal indicators , so it is easy and quick to set up. You will have to download and install the tool with an alert yourself.
Setting up the indicator in the Quik terminal
After opening the chart, right-click anywhere in its range. In the window that opens, select an indicator and click “Add”.
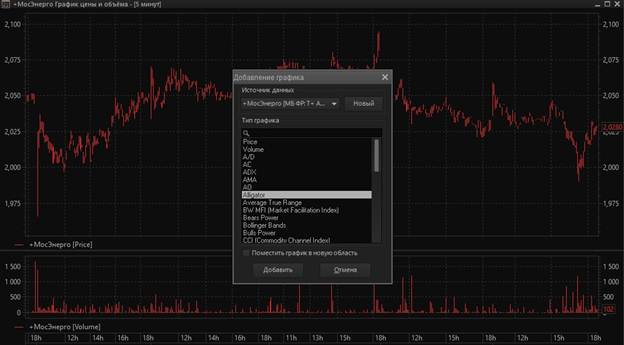
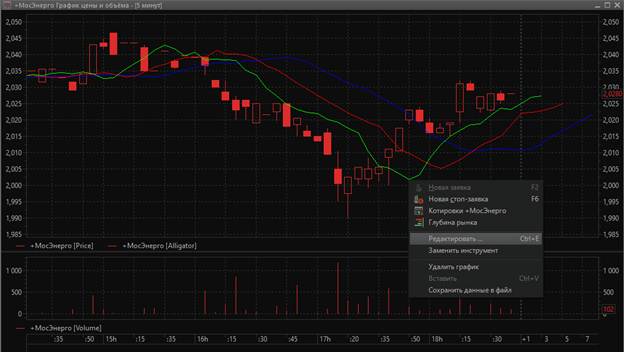
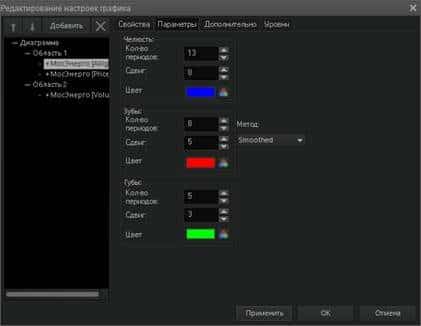
Setting up the indicator in the MetaTrader terminal
In the terminal window, open and set up the chart. After that, set the indicator: go to the “Insert” item of the main menu, hover over the line “Indicators” and select the desired tool in the drop-down list.
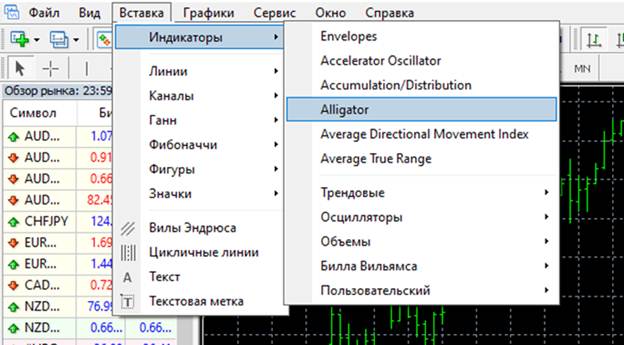
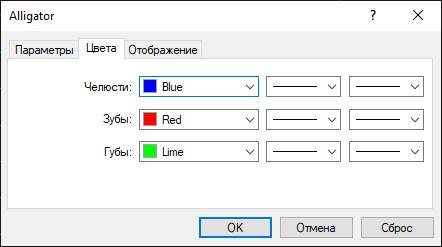
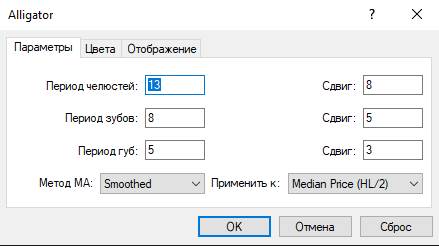
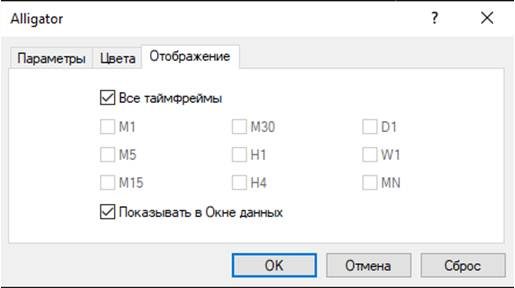
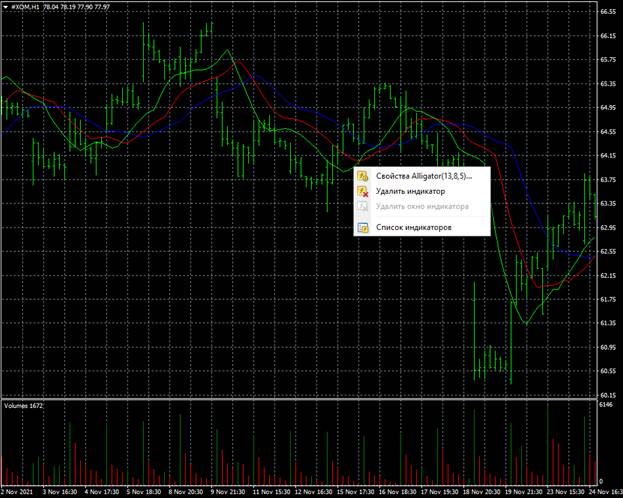
Alligator indicator with alert
Angry Alligator is a modification of the standard Alligator with Alert. It is not included in the standard set of technical analysis tools for trading terminals. is a commercial product. It can be purchased from the developer’s website.
Alert indicators are modified tools equipped with the means of providing sound or text signals about significant events in the market. For example, they can inform the trader about a trend reversal, a potential entry point, etc.
“Alligator” with an alert is supplemented with a mode of notifying the user about standard events. It also displays an additional line on the chart, which smooths out signals at high volatility.
Trading Strategies with Alligator
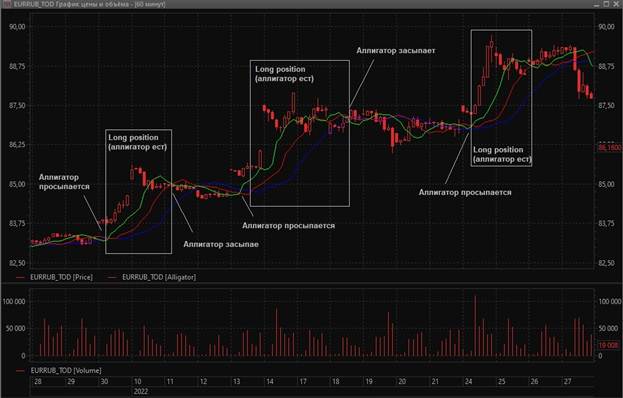
The indicator warns about 3 stages of market development, understanding which, you can develop a simple method of trading in any markets.
| State | Indicator behavior | Market situation | Actions |
| Alligator “sleeping” | Moving averages are intertwined | The market is resting | Inaction or trading in a sideways range |
| Alligator “wakes up” | The green line crosses the red and blue | High probability of trend formation | Active surveillance and search for a possible breakout point |
| Alligator “eats” | Interval charts close above/below 3 moving averages | The trend is set | Opening and holding orders |
Trades in a sideways range
In the absence of a trend, some traders prefer to trade in a sideways range. In this case, support and resistance zones are used that cross the extremes of the price corridor. Trades are made against these potential boundaries.
Pullback trading
When the moving averages of the indicator indicate an established trend, you can start trading on pullbacks. It is necessary to analyze the chart and identify the prevailing pattern. Technical pullback lines should be parallel, indicating a strong trend.
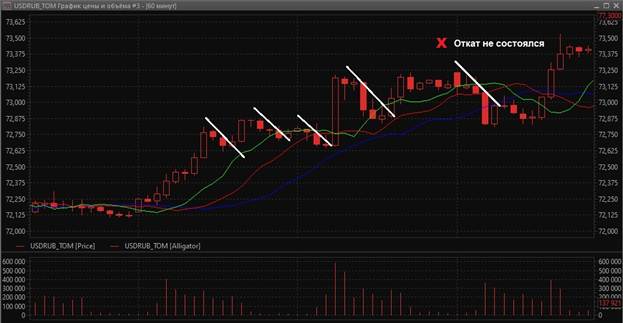
Moving Average Crossover Analysis
The simplest trading strategy for the Alligator is to take trades at the close of the candle above/below the moving averages of the indicator, provided that the green and red lines form a cross.
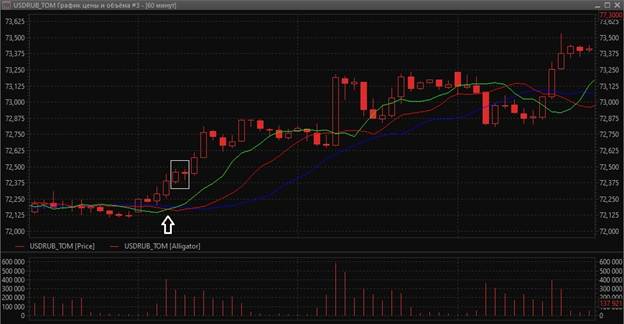
Combination of indicators “Alligator” and “Fractals”
Although the Alligator is considered a self-contained technical analysis tool, it is often combined with the Fractals. The last indicator marks extremes on the price chart, marking them with up or down arrows. It was also designed by B. Williams and is included in his trading system. A strategy based on a combination of Alligator and Fractals is trending and therefore does not work in sideways ranges. Its essence is to catch a strong trend at the very beginning of its formation.
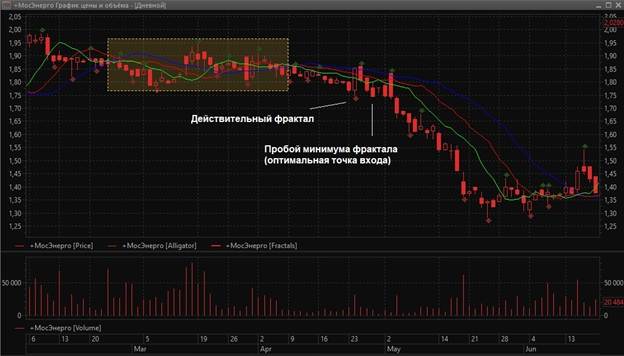
Errors in interpretation
The indicator may give a false signal when 3 lines cross multiple times due to market volatility. However, at this point, the “alligator” continues to “sleep”, and the trader does not need to take any action. This exposes a significant drawback of the indicator, since many wake-up signals do not work in large ranges.
