What is Parabolic sar, how to use it, settings, formula, trading strategies.Participants in exchange trading, especially professional specialists or experienced traders, are good at finding accurate and winning points for entering the financial platform. However, the question of when and where to exit a position is often much more difficult than the issue of entering the market. A good auxiliary option in this case can be a technical tool that indicates price and time and is called the parabolic system. The tool is called that because of its format – the curve resembles a parabola or a curved straight line, which was described by stock trader Welles Wilder in his work “New Concepts in Technical Trading Systems”. In his work, the author talks about the very parabolic system that is used in the process of exchange trading, and other options that form the basis for technical analysis of the financial market.

- Parabolic sar technical indicator: what is the instrument, what is its meaning and what is the formula of the algorithm for its use
- How Parabolic sar functions
- Formula for using the parabolic system technical indicator
- How to use Parabolic SAR in your trading process: SAR-based trading setup and strategies
- How to use the parabolic system in stock trading and financial niches
- Setting up the Parabolic SAR system for trading on the stock exchange
- A trading system based on the Parabolic SAR system: when to use the tool
- Advantages and disadvantages of the parabolic system
- Use of Parabolic SAR in various terminals
- Practical use of the Parabolic SAR technical instrument in the MetaTrader5 trading terminal
- Using a technical instrument on the trading floors of brokers
Parabolic sar technical indicator: what is the instrument, what is its meaning and what is the formula of the algorithm for its use
The tool, which is part of the parabolic system, denoting the price module and the time period – Parabolic sar, was first mentioned by the exchange participant and the author of practical publications in the work “New Concepts in Technical Trading Systems” – Welles Wilder in the late 70s of the 20th century. The meaning of this tool is to identify the period when the trend changes, to close one element and open the opposite. The creator of the parabolic system immediately closes two problems that are relevant for most trading floors, driven by the trend: late market exit signals and the inability to consider time as an element for identifying stopping points. Parabolic sar solves these shortcomings by the fact that after the start of a trading position, the robot, with the end of a certain period of time, reduces the scope,
How Parabolic sar functions
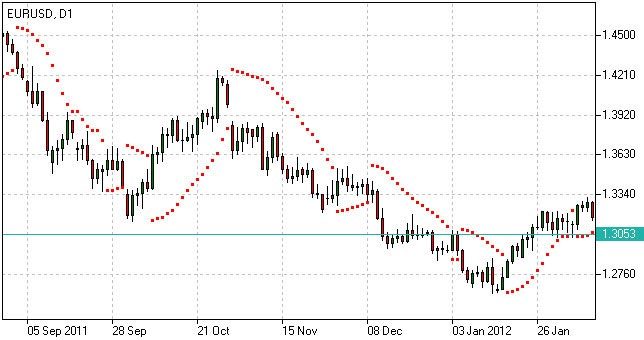
The technical instrument is marked directly on the graphic image of the price module. His work is based on a set of moving average lines decreasing one after another. Whenever the price module during the formation of a new trend reaches the top of the value, the
moving average lines are automatically shortened.
The minimum value of the acceleration factor, which is equal to 0.02, increases by the same amount daily and overcomes the maximum values if the price module is heading towards the current trend.
Formula for using the parabolic system technical indicator
There are two formulas for using a technical indicator:
- For long trades:
SAR (i) = SAR (i – 1) + ACCELERATION * (HIGH (i – 1) – SAR (i – 1));
- For short trades:
SAR (i) = SAR (i – 1) + ACCELERATION * (LOW (i – 1) – SAR (i – 1)). Consider the notation:
- SAR (I – 1) – the value of the instrument on the previous element of the quotes chart, which displays the movement of the price module over a certain period of time;
- ACCELERATION – element of acceleration;
- HIGH (I – 1) – the maximum value of the price module for the past timeframe;
- LOW (I – 1) – the minimum value of the price module for the past timeframe.
The value of a technical instrument will increase if the price module of the current element of the quotes chart is greater than the previous one in the consumer market, it also works in the other direction. In addition, the acceleration element doubles, which brings the parabolic system and price modules closer together. To put it simply, the higher the rate of growth or fall of the price module, the higher the rate of movement of the monitored technical instrument. The technical indicator follows the current trend until it breaks the dead point and changes direction. It turns out that the indicator is unfolding, this may indicate both the end of the trend and other factors related to the topic.
How to use Parabolic SAR in your trading process: SAR-based trading setup and strategies
How to use the parabolic system in stock trading and financial niches
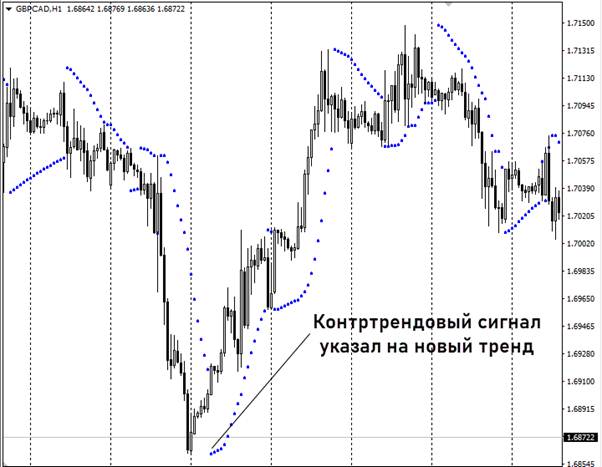
The essence of the parabolic system is to determine the turning points. However, this is not the only way to use this tool. In the trading process, PSAR is applied in different ways. Let’s take a look at these few tricks.
Note! These signals, as a rule, arrive with a strong delay, therefore they are not very temporary notifiers; you should not fully trust and lay responsibility on them. Traders usually use such a signal as an element in the trading terminal filtering.
During the period when the price module keeps the direction in a certain range without a clearly defined direction, this tool will not work – when the conditional “frames” are crossed, the parabolic generates some notifications, but because of their long reaching, they do not make any sense. By the location of the elements of the parabolic system, one can understand the state in which the financial market is now. As a rule, the trend overcomes 3 levels – the beginning, when demand is just beginning to emerge, the main level, when the price module is in active movement, and the final, where the rate of growth / decrease decreases.
- the parabolic system can also be used when accompanying elements; drawing a technical indicator on the chart acts as a dynamic support/resistance, you can issue an order to stop losses for them;
- also, the tool can be used as a guide to set a stop at the entrance to the market territory; a protective stop loss is located behind the indicator points.
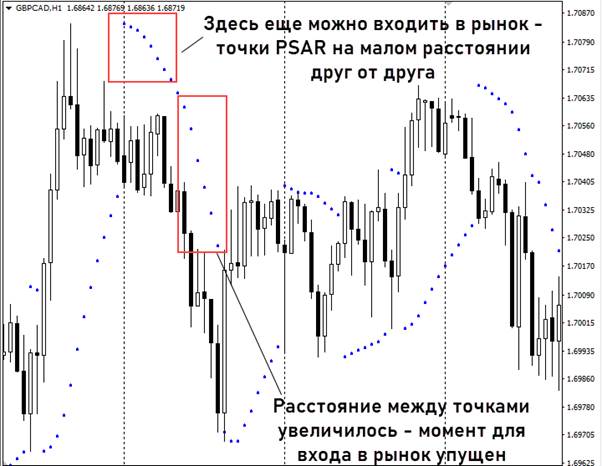
As soon as the trend is close to completion, the graphic image and PSAR dots reduce the distance between each other, at this moment you can close the position. Parabolic SAR indicator: how to use, strategy, settings – https://youtu.be/_dAyaTmi0dI
Setting up the Parabolic SAR system for trading on the stock exchange
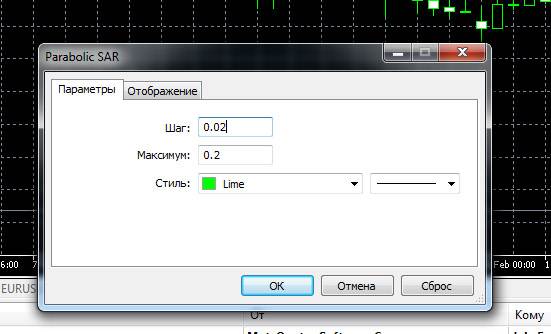
Setting up a technical indicator is to select the step and the maximum value for the acceleration element. The system automatically sets these values to 0.02 and 0.2, respectively. If the exchange trader changes parameters, the SAR price module will be closer to the graphic image and more sensitive to fluctuations.
A trading system based on the Parabolic SAR system: when to use the tool
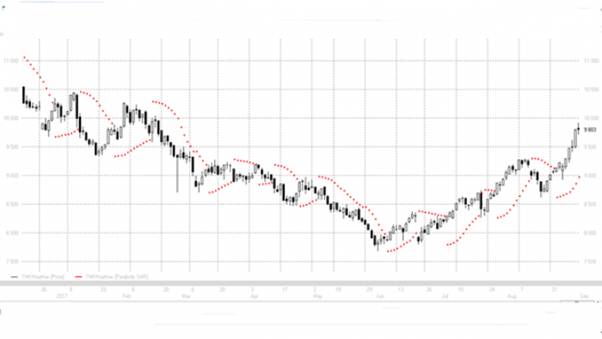
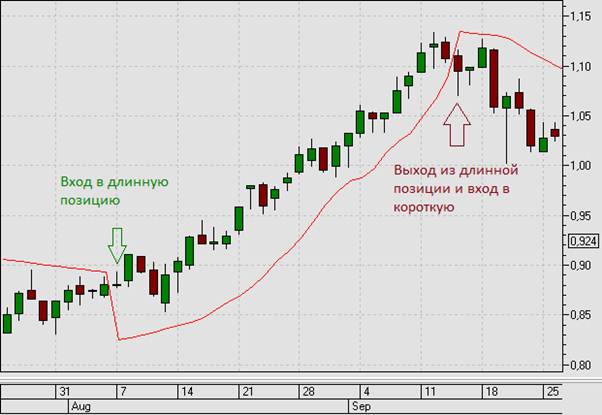
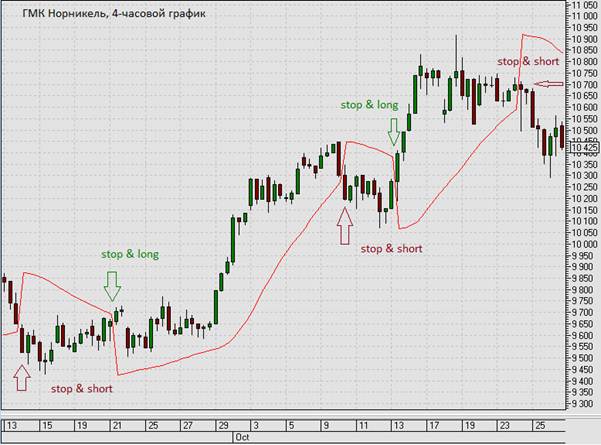
When the placement of a technical instrument changes relative to the price module, a trade is opened in the direction specified by the system. If the actions occur in the opposite order, the trading position is closed and reversed.
The Parabolic SAR indicator works the worst on those elements that have high price volatility on a small timeframe. In this case, the system will send a lot of false notifications, which will lead to large losses.
Advantages and disadvantages of the parabolic system
As practice shows, the Parabolic SAR technical indicator has both strengths and weaknesses. The main advantages are:
- clearly indicates general trends, including large time periods, the level of which exceeds an hour;
- easy to learn, subject to both beginners and experienced participants in exchange trading;
- combined with any other technical indicators;
- not demanding – the indicator does not need to be carefully configured, since the default parameters are already intended to be used in practice.
However, the system also has some drawbacks that also affect the trader’s trading efficiency:
- the indicator shows good results only in combination with other technical tools;
- to develop a working strategy, you will have to spend a lot of time – entering the market only on PSAR signals is not a good option;
- Parabolic SAR shows effective results only in a trending market;
- the technical instrument is not active when the news is published, which is the biggest disadvantage of technical analysis; in such cases, it is better to resort to the use of algorithms based on fundamental analysis, which includes not only mathematical data, but also the reaction of the financial niche to various external influencing factors.
Use of Parabolic SAR in various terminals
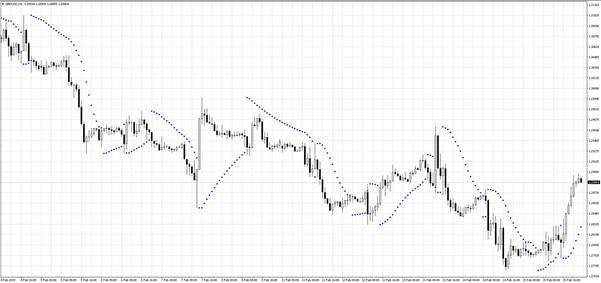
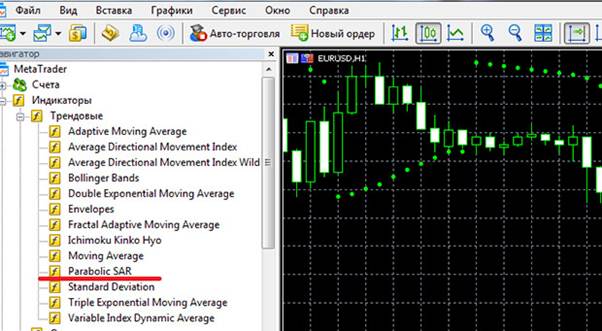
Practical use of the Parabolic SAR technical instrument in the MetaTrader5 trading terminal
The parabolic system is a standard and almost fundamental tool that is used on the MetaTrader5 trading platform and is included in the list of trending ones.
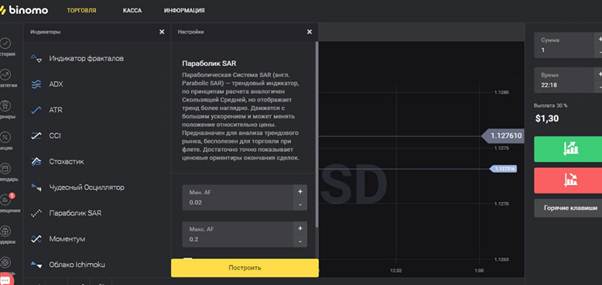
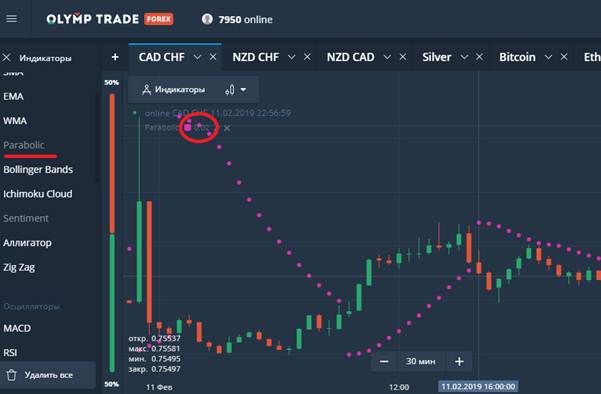
Using a technical instrument on the trading floors of brokers
The Parabolic SAR instrument is included in the binary options terminal for the Binomo brokerage company with standard parameters.