Ichimoku indicator as the basis of a trading system, how to use, settings, secrets, strategies, how to use – description and application. The Ichimoku indicator is a universal
technical analysis tool that displays the market trend, support and resistance levels, as well as entry and exit points on a single chart. https://articles.opexflow.com/analysis-methods-and-tools/osnovy-i-methody-texnicheskogo-trajdinga.htm
- Ichimoku indicator – what are the signals, what is the meaning, calculation formula
- conversion line
- Standard line
- Lead interval A
- Lead Interval B
- Lagging interval
- Cloud
- How to use, setup, trading strategies based on the Ichimoku indicator
- How to use the Ichimoku Cloud indicator?
- When to use Ichimoku and on which instruments and vice versa, when not to
- Pros and cons
- Application in various terminals with application examples in the interface
Ichimoku indicator – what are the signals, what is the meaning, calculation formula
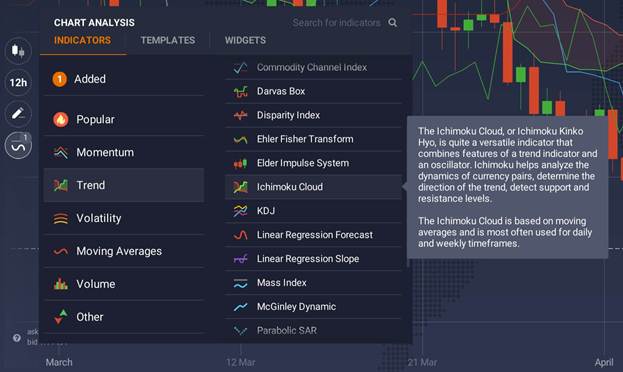
Ichimoku combines several indicators in one chart. Based on candlestick charts, it serves the main purpose of determining the direction and reversal points of the prevailing market trend. It can work as an oscillator. In other words, it measures the rate of price change (momentum) for a given asset. Capable of identifying support and resistance levels during intraday trading sessions using multiple averages and plotting them on a chart. He also uses these numbers to calculate the “cloud”, which tries to predict where the price might find support or resistance.
Interesting to know! Ichimoku kinko hyo (“instant glance at balance”) was developed by the Japanese journalist Goichi Hosoda in the late 1930s, known by his pseudonym Sanjin Ichimoku. For 30 years he perfected the technique before releasing the results to the general public in 1969.

conversion line
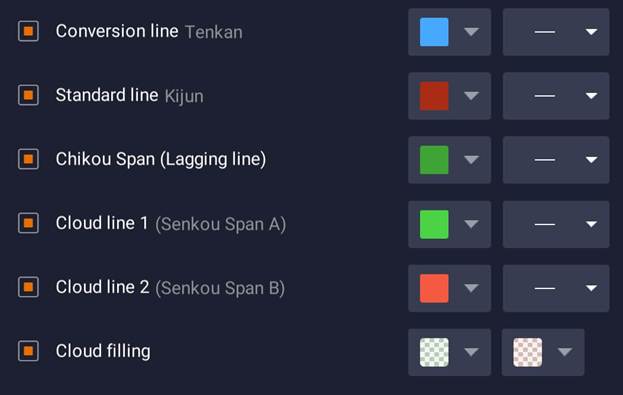
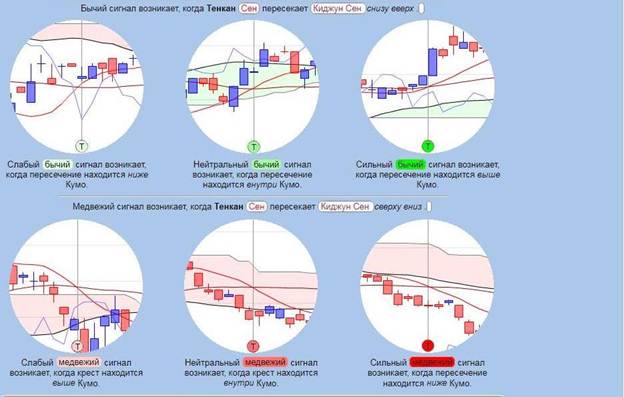
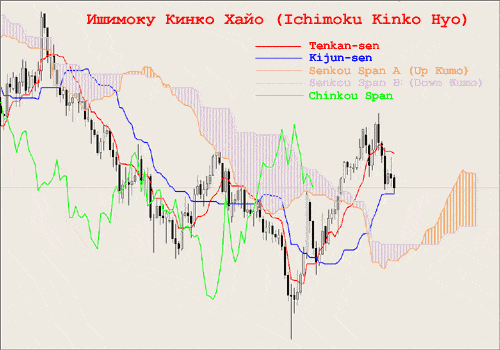
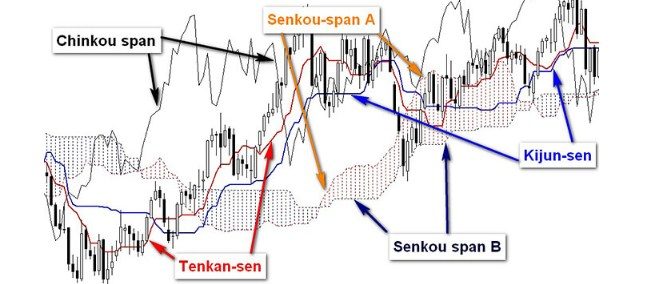
The tenkan-sen or conversion line averages the highest high and lowest low reached by a stock over the past 9 periods. Shows the price momentum of an asset in the short term and can be interpreted as a fast moving average centered on high and low levels.

Standard line
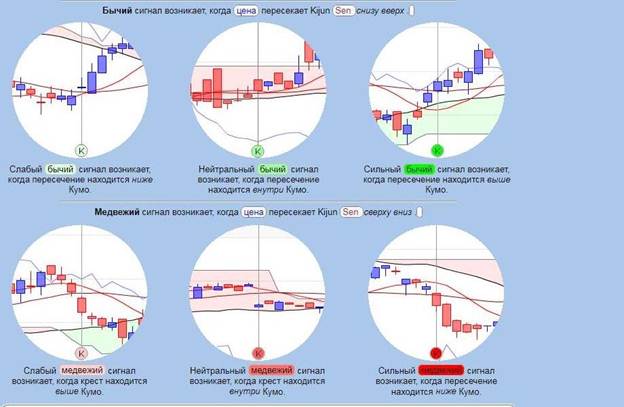
Kijun-sen or standard line performs the same function as Tenkan, with the only difference that the last 26 periods are taken into account. Defined as a slow moving average, it therefore takes more time to “react properly. To generate trading signals, it is almost always used with a conversion line.

Lead interval A
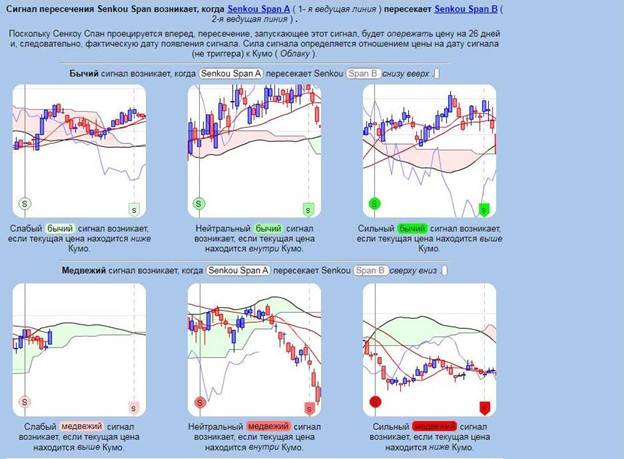
Senkou A or leading interval A is the average between the conversion line and the standard line. The indicator is called a leading one, as it is built with a shift by the value of the second time interval (26 periods), forming a fast cloud boundary. This helps traders predict market movements.

Lead Interval B
Senkou B – maximum and minimum average price for a long period of time, with a shift by an average time period. The calculation is taken for the last 52 days and is based on 26 days ahead.

Lagging interval
Tikou corresponds to the last closing price projected 26 periods ago.
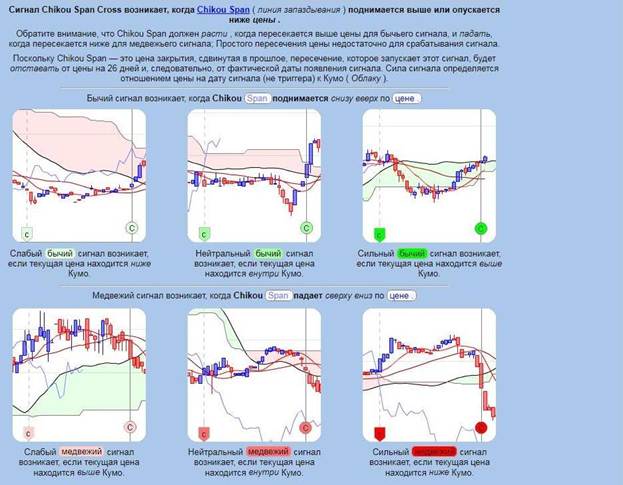
Cloud
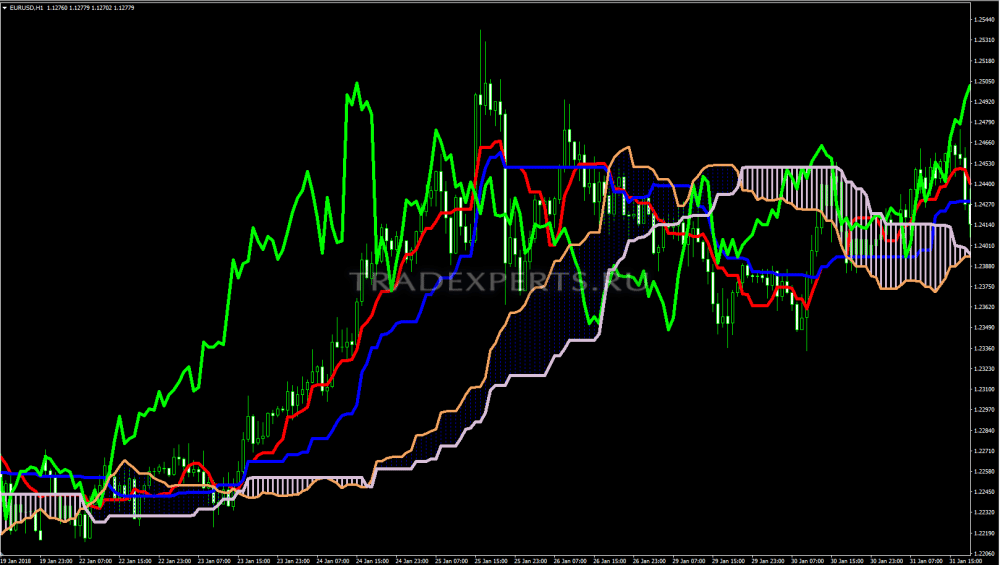
Kumo (cloud) is a key part of Ichimoku. This is the area between Senkou A and Senkou B. A sell signal – when the price pattern enters the cloud and breaks it down, this is a bearish sign. Buy Signal – When a price pattern enters the cloud from below and breaks up through or above the cloud, this is a bullish sign. Potential trend change. The cloud can also indicate a good area of support or resistance. When the price moves away from the cloud, it can signal a change in momentum.

How to use, setup, trading strategies based on the Ichimoku indicator
A trading strategy based on the Ichimoku indicator suggests buy and sell signal alerts given that it is able to identify potential trend direction and momentum. The system can be useful for identifying stop losses that may be at the support level. In addition, it gives some estimate of the future price level. The Ichimoku indicator is a strategy in general:
- Determining the direction of the trend (conversion line and standard line signals) . Tenkan-sen predicts business trends. This means that the stock is trending whether the line is moving up or down. When moving horizontally, it signals the range of the sector. Tenkan is a support/resistance line that can be used as a trailing stop script. Kijun is regarded as an indicator of business activity. The market rises if the price exceeds this predictor, falls if it is below the line. When the price reaches this line, it is necessary to further correct the trend.
- Support and resistance levels (determined by the Senkou A and Senkou B lines, which serve as the edges of the kumo). Since the indicator provides price prediction, the edges of the cloud additionally provide insight into current and future support and resistance levels. When the price is above the cloud, the upper line forms the first support level, and the second line forms the second support level.
- Definition of the intersection (between the conversion line and the standard line). Depending on the type of intersection and whether it is below, inside, or above the cloud, the signal can be weak, neutral, or strong.
- The cloud can be bullish or bearish . Depends on the position of Senkou A and B on the chart and in the cloud. An indication of a possible bullish trend appears when A rises above the B line. A bearish trend can be identified when A falls below B. You can determine the direction of the market simply by studying the colors of the clouds (green (bullish kumo) and red (bearish kumo)) The trend reversal is obvious, when A and B change position.
How to use the Ichimoku Cloud indicator?
It uses 2 criteria – time and standard deviations. Time periods have traditionally been calculated as 9, 26 and 52 based on manual data analysis done in Japan in the pre-computer era (when there was a 6 day work week resulting in 26 trading days per month, 52 days two months). Although it bears little resemblance to today, the use of the 9-26-52 settings is retained as “accepted practice”. Some traders change the values according to different strategies. However, most feel that the use of other periods violates traditional interpretations of the Ichimoku. The Ichimoku cloud indicator consists of a central line with two price channels above and below it (bands). The central line represents the exponential moving average, the price channels represent the standard deviations of the stock under study. Bands can wax and wane as the market behavior of the problem becomes erratic (expansion) or is associated with a strong trading pattern (contraction). On long stretches, the market may trade in a pattern, but from time to time with some deviations. Ichimoku indicator as the basis of a trading system, how to use, settings: https://youtu.be/eGD2TnidSHs The moving average is used by traders to filter market activity to help see patterns. For example, after a sharp uptrend or downtrend, the market may stabilize by trading in a narrow direction and crossing above and below the moving average. To help track this behavior, traders use price channels that include trading activity around a trend. how the market behavior of the problem becomes erratic (expansion) or is associated with a strong trading pattern (contraction). On long stretches, the market may trade in a pattern, but from time to time with some deviations. Ichimoku indicator as the basis of a trading system, how to use, settings: https://youtu.be/eGD2TnidSHs The moving average is used by traders to filter market activity to help see patterns. For example, after a sharp uptrend or downtrend, the market may stabilize by trading in a narrow direction and crossing above and below the moving average. To help track this behavior, traders use price channels that include trading activity around a trend. how the market behavior of the problem becomes erratic (expansion) or is associated with a strong trading pattern (contraction). On long stretches, the market may trade in a pattern, but from time to time with some deviations. Ichimoku indicator as the basis of a trading system, how to use, settings: https://youtu.be/eGD2TnidSHs The moving average is used by traders to filter market activity to help see patterns. For example, after a sharp uptrend or downtrend, the market may stabilize by trading in a narrow direction and crossing above and below the moving average. To help track this behavior, traders use price channels that include trading activity around a trend. On long stretches, the market may trade in a pattern, but from time to time with some deviations. Ichimoku indicator as the basis of a trading system, how to use, settings: https://youtu.be/eGD2TnidSHs The moving average is used by traders to filter market activity to help see patterns. For example, after a sharp uptrend or downtrend, the market may stabilize by trading in a narrow direction and crossing above and below the moving average. To help track this behavior, traders use price channels that include trading activity around a trend. On long stretches, the market may trade in a pattern, but from time to time with some deviations. Ichimoku indicator as the basis of a trading system, how to use, settings: https://youtu.be/eGD2TnidSHs The moving average is used by traders to filter market activity to help see patterns. For example, after a sharp uptrend or downtrend, the market may stabilize by trading in a narrow direction and crossing above and below the moving average. To help track this behavior, traders use price channels that include trading activity around a trend. to help see the pattern. For example, after a sharp uptrend or downtrend, the market may stabilize by trading in a narrow direction and crossing above and below the moving average. To help track this behavior, traders use price channels that include trading activity around a trend. to help see the pattern. For example, after a sharp uptrend or downtrend, the market may stabilize by trading in a narrow direction and crossing above and below the moving average. To help track this behavior, traders use price channels that include trading activity around a trend.
When to use Ichimoku and on which instruments and vice versa, when not to
Many traders around the world determine their trading strategy by the time horizon of the trade. One trader may be a day trader, another a position trader, and yet another focuses on catching the swing. The Ichimoku trading indicator is suitable for everyone. https://articles.opexflow.com/strategies/swing-trading.htm
Interesting! Few traders pay attention to what the market is thinking right now. This can be described as a consensus expressed in the price of any instrument. Most focus on the money they put into the deal. Meanwhile, different timelines tell different stories.
A trader who trades on a daily chart sees a very different picture than one who trades on a 30-minute or multi-hour chart. Since the risk profile of both is likely to change day and night (in terms of the number of points of risk compared to the desired profit), it is better to find the most convenient time frame and apply the chosen indicator to this chart. Secrets:
- Calculated by Ichimoku automatically based on the system used and updated every time the timeframe function changes. Ultimately, it comes down to which trader is trading specifically. For scalpers, the use of the Ichimoku indicator is possible on a short timeframe, from a 1-minute chart to six hours.
- For long term traders can be used on daily or weekly charts.
- In many cases it is useful to zoom in and out of charts to get a better idea of market sentiment.
- The best markets to trade are currency pairs with a large range of movement, like EUR/USD or GBP/JPY.
Pros and cons
The Ichimoku trading system has strengths and potential weaknesses, depending on how it is used in a trader’s strategy. The averaging method, which recognizes reversal patterns, offers a better indication of future market activity than traditional candlestick charts because it includes more data points. https://articles.opexflow.com/analysis-methods-and-tools/svechnye-formacii-v-trajdinge.htm The key difference compared to other approaches is that the lines are plotted using a 50 percent high and low point, not the closing price of the candle. The Ichimoku cloud strategy takes into account the time aspect as an external variable along with the market behavior. What makes this predictor easy to use and synergistic as a chart evaluation tool is that that all lines and data are displayed in correlation with each other. Representing a scalable metric, the application of the Ichimoku indicator allows traders to evaluate the trajectory of a trend, calculate strength, attract support and resistance, and so on.
The name “instant look at the balance” actually means that traders can recognize the direction of the sector at a glance and find possible buy / sell triggers within the model.
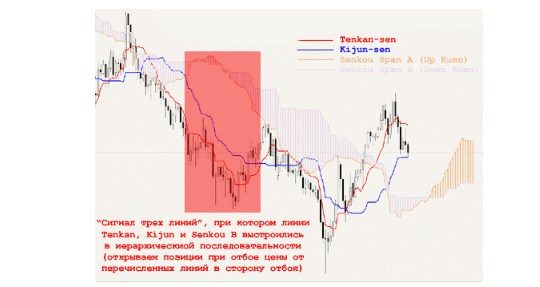
- clearly gives entry and exit signals (due to the intersection between Tenkan and Kijun);
- predicts future trends in the market (using Senkou A and Senkou B, forming Kumo);
- determines the strength of the trend (thanks to Chikou).
The Ichimoku indicator as the basis of a trading system can be configured on most platforms. MetaTrader 4 or 5 makes it easy to remove certain lines that are not being used at a particular time, providing a clearer view of important data. However, Ichimoku is not without certain limitations, especially depending on what kind of trading analysis approach is used, how a trader tries to enter and exit trades. Flaws:
- lagging signals (since the indicator is based on moving average data, this limitation is unavoidable);
- a loaded chart (which can disrupt the ability to evaluate trades), although this can be corrected by adjusting the indicator:
- potential loss of trend relevance for traders focused on long time frames of trading.
Moving averages are good for intraday trading. The time frame for them does not allow traders to focus on long-term positions that can be held for months. The cloud can also become irrelevant for extended periods of time as the price stays far above or below it. At such moments, the conversion line, the standard line and their intersections are more important, they are usually closer to the price.
Note! All indicators built on averaging values depend linearly on the timeframe for which they are built. As the timeframe decreases, their predictive ability decreases. Small time frames reflect short-term price changes that are filled with market noise, and averaging the data gives mixed results. Thus, given that the Ichimoku is made up of moving averages, caution should be exercised when used on small timeframes.
Ichimoku Indicator description and application, which can be found on many trading platforms, has another limitation – it is based on historical data. This is not a discrete trading system, in fact, a single metric designed to provide information about market volatility. Financial analysts suggest using it along with 2-3 other uncorrelated indicators that provide clearer consumer signals and the Relative Strength Index (RSI). Since technical indicators are calculated using a basic moving average, they determine old price indicators as well as fresh ones. This means that new information may be distorted by outdated data.
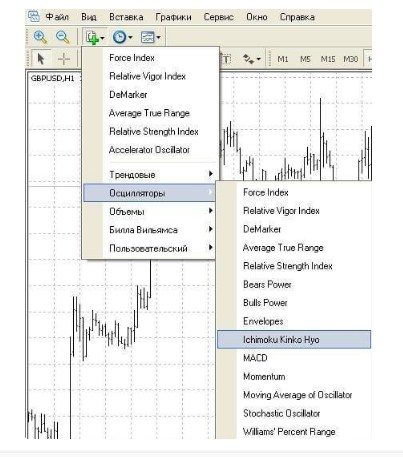
Application in various terminals with application examples in the interface
The technical analysis tool is available on most trading platforms and is included in the standard package of MetaTrader 4 and MetaTrader 5 tools. You do not need to search for it on the Internet in order to download Ichimoku from third-party resources.
