What are reversal patterns and what is their essence, how to build and read Japanese trend reversal candlestick patterns on charts. A reversal pattern in trading is a
trend reversal . In
technical analysis , the transition from an uptrend or downtrend is often determined by price movements. By definition, a price pattern is a recognizable graphical pattern of value movement that is identified by a chart. When a price pattern signals a change in trend direction, it is called a reversal. A continuation pattern occurs when a trend continues in its current direction after a short pause.
In other words, reversal patterns in trading represent a transitional stage that marks the turning point between rising and falling markets. If prices were rising, the enthusiasm of the buyers outweighed the pessimism of the sellers up to that point, and prices rose accordingly.
If prices were rising, the enthusiasm of the buyers outweighed the pessimism of the sellers before and prices in the market rose accordingly. In the transition phase, the balance becomes even as long as the relative weight of selling pushes the trend down. In this case, it does not change. When a falling market closes, the process is reversed Imagine a fast moving train that takes a long time to slow down and then reverses. The same thing happens to the market when Japanese candlestick reversal patterns or other patterns occur.
What you need to know about reversal patterns?
There are different scales of reversals. It takes weeks or even months for something global to happen. Otherwise, more short-term changes are called corrections or pullbacks. But these are all reversal patterns. 
- There are two types of reversal scales, these are trend and corrective . The first is the largest and strongest side of the market movement. The second one is weaker.
- The lows are starting to increase . This indicates the intention of buyers to purchase at higher prices. However, this is not a clear sign of a reversal.
- Time factor . If the pattern appears over a large time period, this indicates that it will be more significant.
Observing these features helps the trader to use this pattern effectively in his trading. At the same time, this will prepare the specialist for unforeseen risks. https://articles.opexflow.com/strategies/trend-v-tradinge.htm
Head and shoulders like a reversal pattern
The technical analysis
head and shoulders pattern is one of the most famous and recognizable of all reversal patterns. It should be noted that for the pattern to be valid, there must be a prior reversal trend. This figure on the chart resembles the shape of the shoulders and head. Usually everything starts with an uptrend. Prices rise higher and higher to create the highest peak, which is called the head. The lower peaks on either side of the head are called the shoulders. The neckline is drawn by connecting the bottom points of the two gutters on both sides of the head.
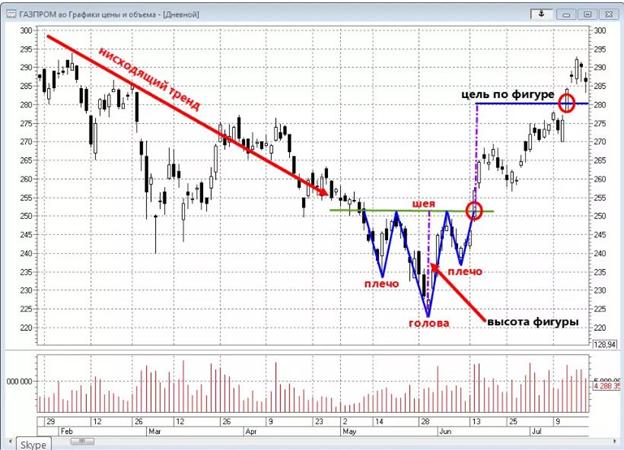
Important! As the price falls below the neckline in the right shoulder, a downtrend begins to move.
In this charting, a sell position can be entered at a breakout point below the neckline. Now let’s give an example of a reversed head and shoulders pattern. This works the same as a normal head and shoulder pattern, the only difference being that the head is upside down. In this case, a downtrend appears, where the head looks down. A buy position can be entered at the break point from the neckline.
Descending triangle
The descending triangle is a bearish pattern that is characterized by a descending upper line and a flat lower line that acts as support. This trend indicates that sellers are more aggressive than buyers as price continues to make lower highs. The pattern completes itself when the price exits the triangle in the direction of the overall trend.

double top
A double top is another type of reverse pattern that has two peaks at roughly the same level. These are the highest rallies after an uptrend where prices find strong resistance. A double top pattern signifies a reversal from an uptrend to a downtrend.
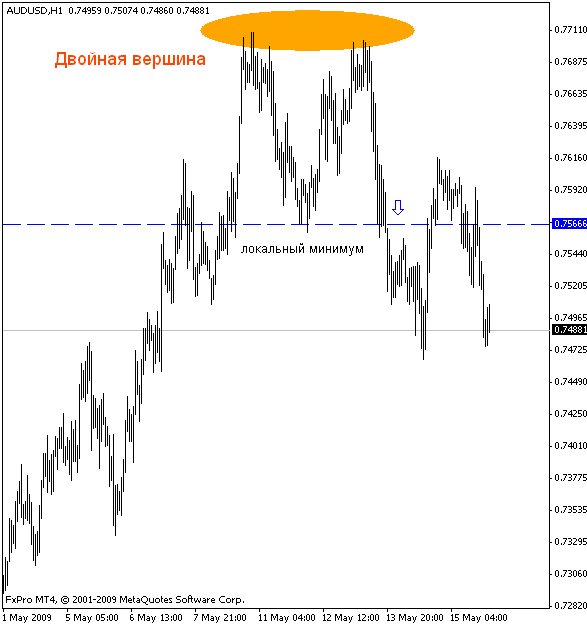
Additional Information! When prices rise, they reach the first high (peak) and then bounce back to find support before bouncing back.
Prices cannot rise above the first peak and find strong resistance to the price level reached at the first peak. Subsequently, prices fall. After retesting the resistance level, prices fall and penetrate the neckline. This is when we have a double top pattern and a change in trend is confirmed. Just below the breakout point, it becomes possible to enter a sell position.
Pattern rules
Be aware of the narrow rules of reversal patterns. They will help you trade more efficiently in the stock or financial market:
- No need to try to be the first and catch a very high or very low point. However, it is worth remembering that you do not need to enter a reversal too late, when the price has already fled from the extreme.
- Rules to be followed – usually reversals are traded, such as low local prices, positive deltas and buyers stuck on the low bar;
- Accept losing trades without emotion. Reverse models don’t always work. If there is a desire to recoup after a losing trade, then perhaps the reverse movement is not the right trading strategy.
- No need to persist in looking for a reversal on trend days. Of course, the price will change sooner or later, but it may not be today, and not after the deposit expires.
To work with reversal patterns, you should also follow the general rules that will help in all trading. After all, the psychology of trading primarily affects the success of a specialist:
- Be disciplined.
- Have your own plan.
- Avoid advice from gurus on a particular position.
- Avoid the obvious. If you follow the general strategy, it is unlikely that everything will be successful in the conditions of fierce competition.
- Avoid the desire to recoup. Emotions will not do any good in a game with reversible pieces.
- Watch out for early change clothespins.
- Do not rely on expensive software. Many try to make money with smart programs, but they don’t know how to think like a person.
- Refuse the panacea. Each case deserves an individual approach.
https://articles.opexflow.com/trading-training/dlya-nachinayushhix.htm Basic reversal patterns, rules and strategies for trading Japanese trend reversal patterns: https://youtu.be/UvKSDd1Jk6c In addition, these rules will help in trading with reverse figures. But not only with them. It is worth carefully approaching the general plan and strategy, then luck will accompany you throughout the entire trading path.
How to trade reversal patterns
Each figure requires an individual approach. For example, when trading with a descending triangle, traders need to identify a downtrend. After that, a descending triangle appears and forex candles begin to consolidate. The measuring technique can be applied as soon as the triangle is formed as traders predict a breakout.
Important! After seeing a long break and a level below support, traders can enter a short position by placing a stop on the last change in heights and take a profit target according to the measurement technique.
As for the double top, there are two ways to trade using double top and double bottom patterns: you go short with a double top and you go long with a double bottom. However, before doing so, it is important to confirm the signal with other technical indicators such as the relative strength index (RSI) or the parabolic SAR – both of which are momentum indicators. While it may be possible to change empty price charts, many professionals advise using additional tools to support the decision-making process. Trading concepts and indicators provide a framework for price analysis and can help you stay more objective.
Mistakes when working with reversal patterns
There are mistakes that most traders make when working. Reversal patterns do not make concessions. The main mistakes are:
- Gambling desire . However, the reversal pattern is very unpredictable. Any emotional trading in most cases leads to a crash.
- Desire to discover a pattern in trending time . It is very difficult to identify it if you look for it. In this case, the probability of error is very high.
- The pursuit of superiority . It is desirable to observe the golden mean.
Do not deviate from your rules and strategies. Even in moments when the temptation is very great, one should not succumb to excitement. If a trader manages to avoid these mistakes, he will significantly reduce the likelihood of his defeat.
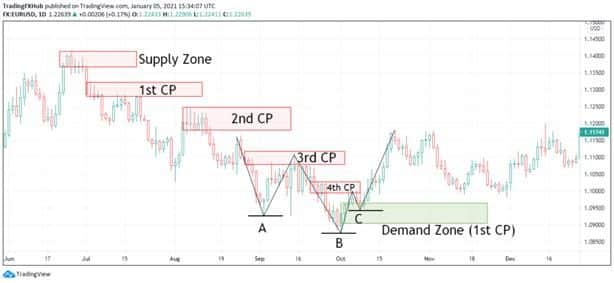
Clearly other reversal patterns
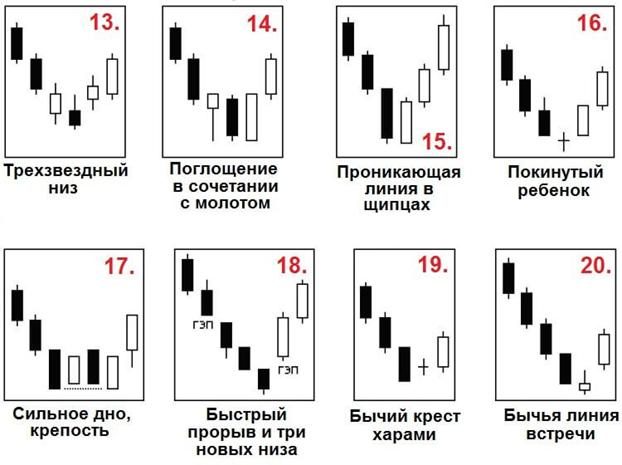
The hammer reversal pattern and other trend reversal candlestick patterns are best studied using the special charts below.
